Optimism around South Africa’s residential property market continues, as the long-term appeal of this sector holds strong, despite tough economic conditions.
Lightstone data based on property transfers registered in the deeds office shows that the national year-on-year house price inflation is at 4.6%, marking a third consecutive month under the 5% growth mark.
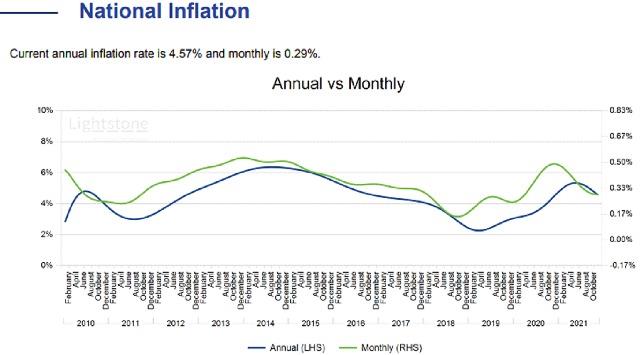
A snapshot of the market over the last decade shows that after the economic recession in 2008, house price inflation saw lackluster growth, only peaking at 6.35% at the end of 2014. In 2019, house price inflation ended just on 2%.
READ: 2021 in Review | SA's top performing suburbs with the most homes sold
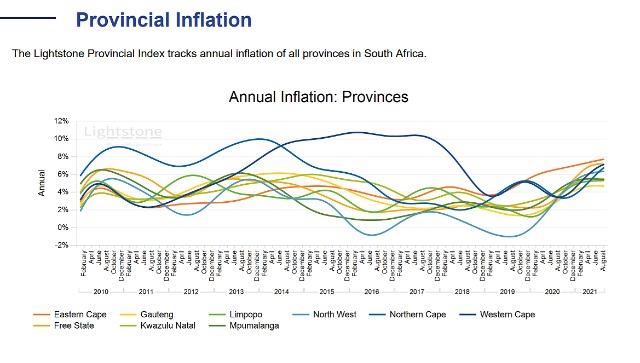
Headed into 2022, inflation remains steady in most provinces, with the exception of Mpumalanga which saw a slight decrease. According to Lightstone, price inflation in the Western Cape has risen steadily this year, from just 4.3% in 2020 to 6.9% by the third quarter of 2021.
"An assessment of semigration trends shows middle-class homeowners are leaving Gauteng in increasing numbers with the "Western Cape as their preferred destination and we are also fielding increased inquiries from other provinces.”
READ: Underrated neighbourhoods in Cape Town with homes under R3m
"Prices in the Low Value segment continue to outgrow those in the higher value segments. The current inflation rate for this segment is currently at 9.6%, almost double that of the Mid Value segment (5.1%). "
Investment opportunities for 2022
Paul Stevens, CEO of Just Property, says, "It takes time to recover financially and, nationally, nominal house prices increased by 3% year on year in September 2021, slowing gradually from the pandemic peak of 5.1% in April 2021, according to FNB data.
"We expect this same sluggishness in 2022. Looking ahead, there is real growth potential for landlords who invest in systems and properties linked to sustainability (for example, ensuring the availability of water and the production of energy).
"In terms of areas, I recommend focusing on coastal cities and towns. These are the areas that have seen better performance from a property value perspective, and demand remains strong due to many people semigrating to the coast."
Want all the latest property news and curated hot property listings sent directly to your inbox? Register for Property24’s Hot Properties, Lifestyle and Weekly Property Trends newsletters or follow us on Twitter, Instagram or Facebook.
*Disclaimer: The Annual Inflation Table (below) provides a long term view of annual rates of inflation for various geographical areas and property types. Please note that historic inflation rates can change as transactions occur that imply price inflation for those periods. Lightstone applies the repeat sales methodology when reviewing and reporting on property data. In contrast to 'average house price' indices, repeat sales indices provide a measure of the actual price inflation of houses that have transacted twice within a particular period of time. The main benefit of this is that it is less influenced by the mix of transacting properties. The repeat sales methodology is recognised as the premier methodology for indexing house prices and is used by many international residential property price indexers including the Office of Federal Housing Enterprise Oversight (OFHEO) in the United States.


